由于上一篇博客写的画图的代码,并不是自己一直想要的那种效果,故而从网上看了看别的代码,找到一个更合适的代码,而且能直接设置直方图的高度,不需进行统计得出直方图的高,具体代码和图如下:
import matplotlib.pyplot as plt
import numpy as np
plt.title("alpha=0.8")
x = np.arange(3)
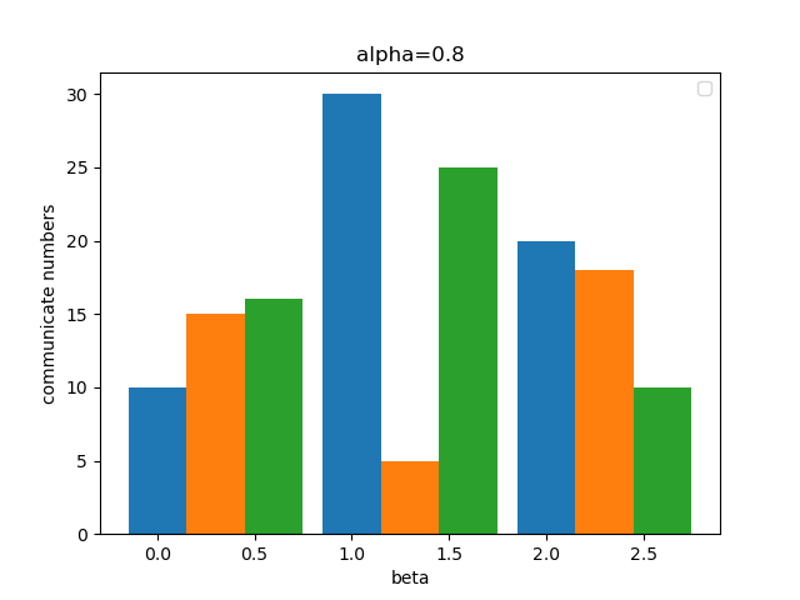
y_1 = [10, 30, 20] #第一列第二列第三列中第一个高度
y_2 = [15, 5, 18] #第一列第二列第三列中第二个高度
y_3 = [16, 25, 10] #第一列第二列第三列中第三个高度
bar_width = 0.3 #控制bar的宽度
#------------------------------
#这里放置添加 数据标签 的代码
#------------------------------
plt.bar(x, y_1, bar_width)
plt.bar(x+bar_width, y_2, bar_width, align='center') # x+bar_width 是画第二个bar的起点
plt.bar(x+bar_width+bar_width, y_3, bar_width) # x+bar_width+bar_width 是画第三个bar的起点
# plt.legend(loc="upper right") #图例 右上角
plt.xlabel("beta")
plt.ylabel("communicate numbers")
plt.show()
结果图如下:
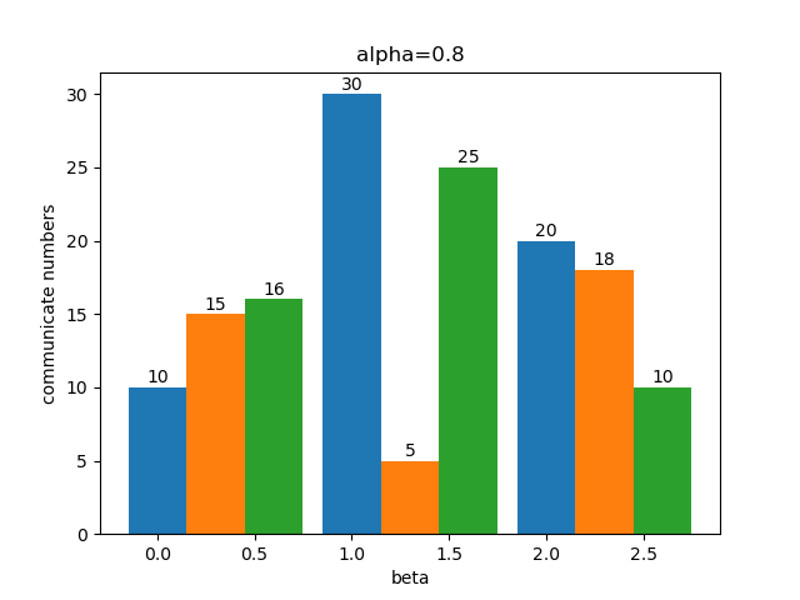
 如果想在对应直方图位置上添加数字标记只需要理解如下代码:
# 添加数据标签的代码
for a, b, c, d in zip(x, y_1, y_2, y_3):
    plt.text(a, b + 0.05, '%.0f' % b, ha='center', va='bottom', fontsize=10)
    plt.text(a+bar_width, c + 0.05, '%.0f' % c, ha='center', va='bottom', fontsize=10)
    plt.text(a+bar_width+bar_width, d + 0.05, '%.0f' % d, ha='center', va='bottom', fontsize=10)
#注意: 将代码放置在上面标记的位置处
结果如下图:
注意:欢迎转载,转载时请注明来源